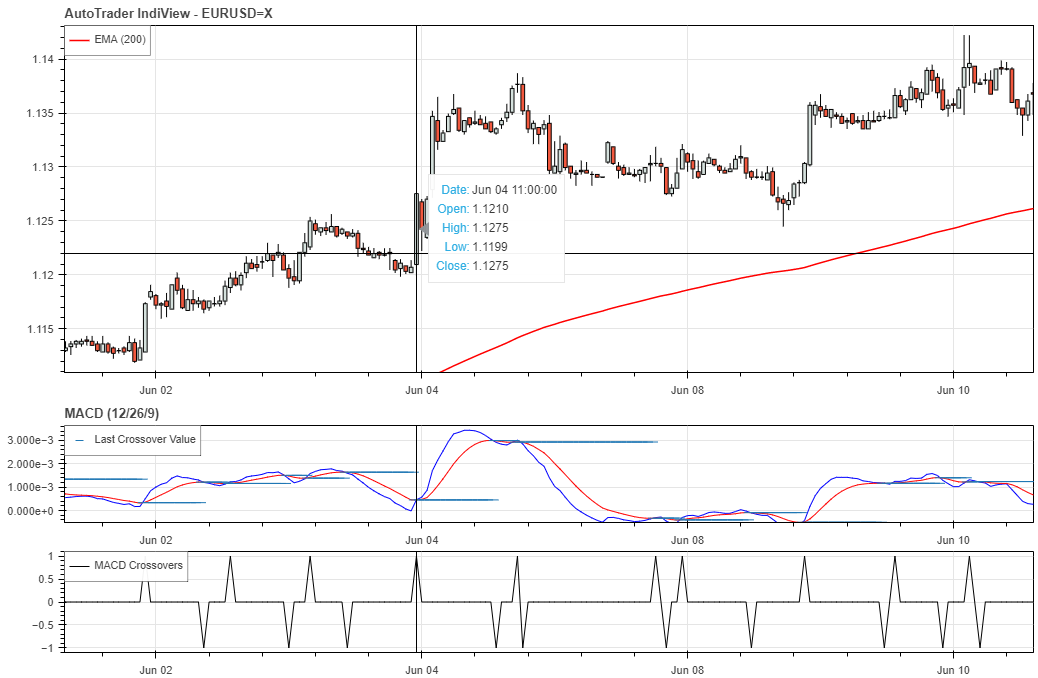
When developing a strategy or your own custom indicator, you need a quick and easy way to see what is going on, whether to debug your code or just make sure everything is running as expected. This is what AutoTrader IndiView is for - viewing price data against indicators. This post will go over how to call AutoPlot to quickly and easily visualise indicators.
Note: a sample script for using IndiView is provided in the demo repository.
Creating the Script
Let’s start with a quick overview of the example script provided in the demo repository. This example plots the MACD indicator for hourly EUR/USD data, alongside the crossover utility indicators from the AutoTrader indicator library. This will tell us both when and MACD crossover occurs, and where the crossover occurs, in terms of MACD values.
Imports
Start by importing the appropriate packages and modules. First, we import AutoPlot, the automated plotting class. Next, we import GetData, to make getting price data convenient. Finally, we import our technical analysis packages - namely, the custom AutoTrader indicators (crossover, cross_values) and the technical analysis module of finta.
from autotrader.autoplot import AutoPlot
from autotrader.lib.autodata import GetData
from autotrader.lib.indicators import crossover, cross_values
from finta import TA
Data Retrieval
Next, GetData is instantiated so that we can download some price data. Note that GetData uses the Yahoo Finance data feed by default, so we do not need to pass any configuration into GetData to instantiate it. However, if you want to use data from one of the supported brokers, you would need to pass in the appropriate configuration file.
# Instantiate GetData class
get_data = GetData()

# Get price data for EUR/USD
instrument = 'EURUSD=X'
data = get_data.yahoo(instrument, '1h',
                      start_time='2020-01-01',
                      end_time='2020-08-01')
Technical Analysis
Now that we have price data, we can move on to the technical analysis side of things. In this example, we plot the 200 period exponential moving average, MACD, and MACD crossovers.
# Calculate indicators
ema = TA.EMA(data, 200)

MACD_df = TA.MACD(data, 12, 26, 9)
MACD_CO        = crossover(MACD_df.MACD, MACD_df.SIGNAL)
MACD_CO_vals   = cross_values(MACD_df.MACD, MACD_df.SIGNAL, MACD_CO)
Plotting
Next, we need to construct a dictionary containing the indicators we wish to plot. This is a nested dictionary to provide
AutoPlot with the indicator names, types and data. Take a look at the AutoPlot documentation for more information. Finally, we instantiate AutoPlot with the main OHLC data to be plotted,
then use the plot method to pass in the indicators dictionary and indicator name.
# Construct indicators dictionary
indicators = {'MACD (12/26/9)': {'type': 'MACD',
                                 'macd': MACD_df.MACD,
                                 'signal': MACD_df.SIGNAL,
                                 'crossvals': MACD_CO_vals},
            'EMA (200)': {'type': 'MA',
                          'data': ema},
            'MACD Crossovers': {'type': 'below',
                                'data': MACD_CO}}

# Instantiate AutoPlot and plot
ap = AutoPlot(data)
ap.plot(indicators=indicators,
        instrument=instrument)
In just a few simple lines of code, you can visualise and interact with price data.
