This post details the development of a technical indicator to detect divergences. If you dont like reading, feel free to skip to the good part.
Motivation
Divergence is commonly used in trading to assess the underlying momentum in the price of an asset, and for assessing the likelihood of a price reversal [1]. It is defined by a divergence in price action and the implied information of some other data, such as an indicator. Usually, this ‘other data’ is an oscillator such as the RSI or Stochastics.
A major benefit of detecting divergence is that it can, in some cases, act as a leading indicator [2]. Although you must wait for a pivot point to be clearly defined, the underlying concept that divergence is built upon implies that a reversal is incoming. This is because divergence implies that momentum is weakening.
To be clear, this post is not about how effective divergence is as a trading tool, but rather about developing the means to detect it. Like all indicators, divergence just filters price action. It is therefore very important not to rely on a single indicator alone to make predicions of price movements. Many different factors must come together at once to create a price movement, and this information can not be gleaned from a single indicator.
Building the Indicator
Before setting off to develop this indicator, I had a look at what others have done to achieve similar. One indicator that caught my eye was TradingView’s built-in “Divergence Indicator”. A screenshot of this indicator in action is shown below on the EUR/USD chart. Note that the candle the signal arrives on is deceptive. I have highlighted the candle at which the indicator will actually tell you that there has been a divergence with a vertical line, and used an arrow to emphasise the entry candle. To see this for yourself, use the replay function of TradingView. You will notice that the ‘Bull’ signal only appears a number of candles after it sits on the chart.

This indicator relies on pivot points to detect changes in direction of price and indicators. Additionally, this indicator only detects the divergence of price from the RSI. Seeing this gave me two goals:
- To detect divergence without relying on pivot points;
- To build a divergence indicator which can be used with any other indicator (eg. RSI, MACD, Stochastics).
By the end of this post, I hope to have achieved the goals above. As a side note, throughout the rest of the post, the charts you see have been generated using using AutoPlot.
Detecting price reversals
The first capability required in building a divergence indicator is the recognition of ‘swings’ or ‘pivots’. That is, detecting highs or lows in some dataset. The most straight-forward way to do this is to simply take the maximium (or minimum) value of the last N periods of the data. This method falls apart in the case of strong trends, in which case the detected ‘swings’ become meaningless. Another approach (as taken in the TradingView indicator) is pivot points.
My approach to solving this problem is more mechanical, and is as follows: by fitting a short-period moving
average to the dataset, I can use the slope to detect local highs and local lows. This is exactly the approach
I have implemented in the find_swings utility indicator. This indicator
is illustrated on the chart below by the dashed lines. The second plot below the price chart shows the implied
trend, yielding a value of 1 when a swing low is detected (implying an uptrend) and a value of -1 when a
swing high is detected (implying a downtrend).
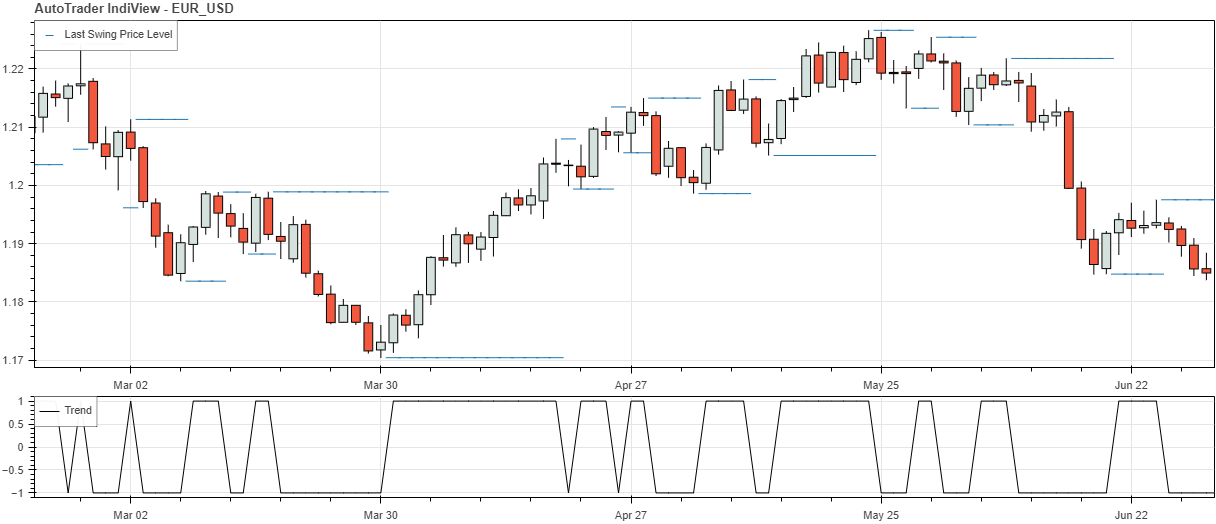
Naturally, this method of caclulating swing levels will be more responsive compared to pivot points. However, this comes at the cost of false signals: the quicker a level is detected, the more likely it is to be a fluctuation due to noise, rather than a significant price level.
Note: as part of the version 0.5.5 release of AutoTrader, this indicator has been generalised to accept
indicators as well as price data. This will come in handy later on - as you will see below.
Support and Resistance
Examing the image of the detected price swing levels above, it is clear that the indicator picks up some movements that are not significant levels. As such, we need a way to filter these out, so that we are left with more significant support and resistance levels. To do this, I will disregard levels detected that last fewer than 1 candle. If we wanted to get even stronger support and resistance levels, we could change this filter to 2 or more candles. The code snippet below accomplishes this.
new_level = np.where(swing_df.Last != swing_df.Last.shift(), 1, 0)

candles_since_last_swing = candles_between_crosses(new_level)

# Add column 'candles since last swing' CSLS
swing_df['CSLS'] = candles_since_last_swing

# Find strong Support and Resistance zones
swing_df['Support'] = (swing_df.CSLS > 0) & (swing_df.Trend == 1)
swing_df['Resistance'] = (swing_df.CSLS > 0) & (swing_df.Trend == -1)
First, we determine when a new level is detected, new_level. This is simply where the most recently detected level does
not equal the previous level. Next, we count the number of candles since the last swing level was first detected. To do
this, I make use of the candles_between_crosses indicator. Finally, we can
determine support and resistance levels by filtering out the swing levels which do not last more than 1 candle.
These support and resistance levels have been added to the chart below. Here you can clearly see that when a swing level
reaches the specified length of 1 candle, it becomes a support or resistance level.
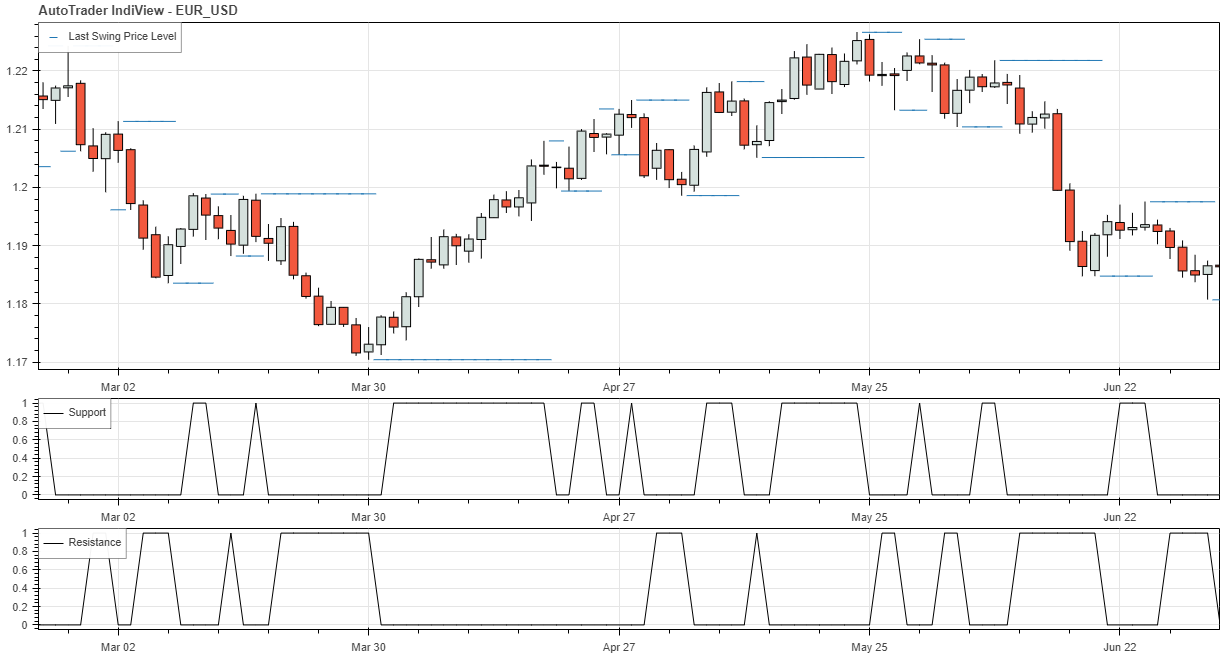
Swing Levels at S&R
The next step is to use the support and resistance levels determined above to calculate the specific data values that correspond to these levels. This is achieved with the code below.
# Find higher highs and lower lows
swing_df['Strong_lows'] = swing_df['Support'] * swing_df['Lows'] # Returns high values when there is a strong support
swing_df['Strong_highs'] = swing_df['Resistance'] * swing_df['Highs'] # Returns high values when there is a strong support
The result of this is shown below. Note that the indicators will very closely resemble the support and resistance levels calculated previously. Now, however, we can see what data values the support and resistance levels occur at, rather than simply when they occur.
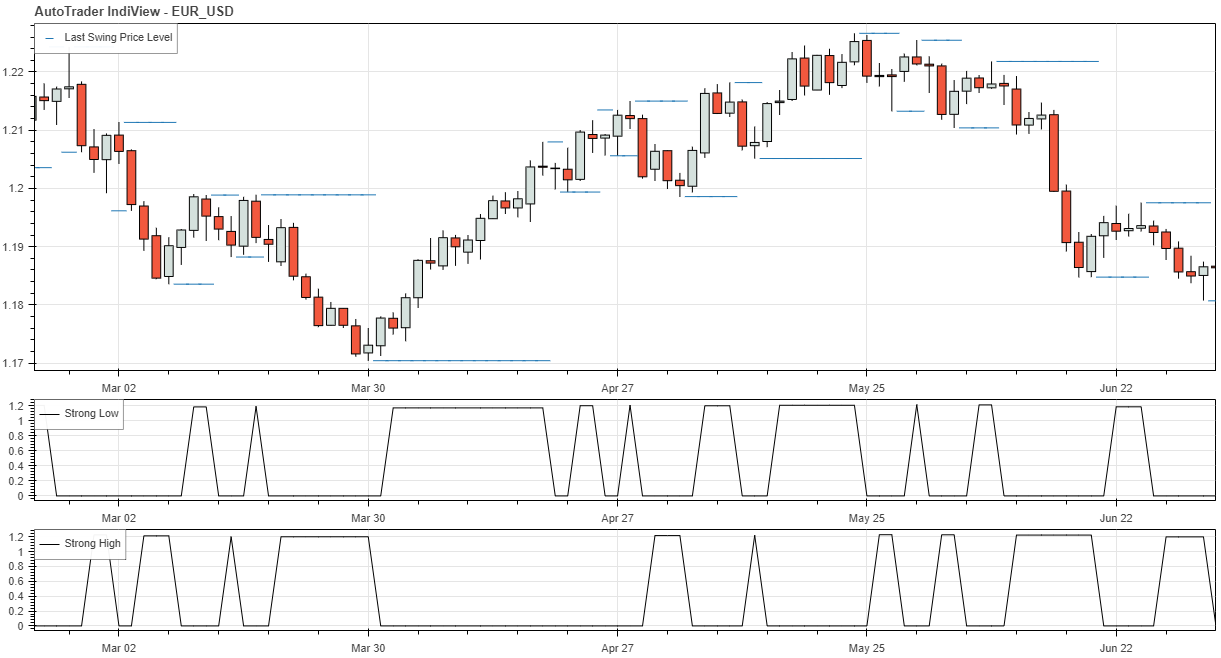
First occurrences
first occurance of strong high or low levels
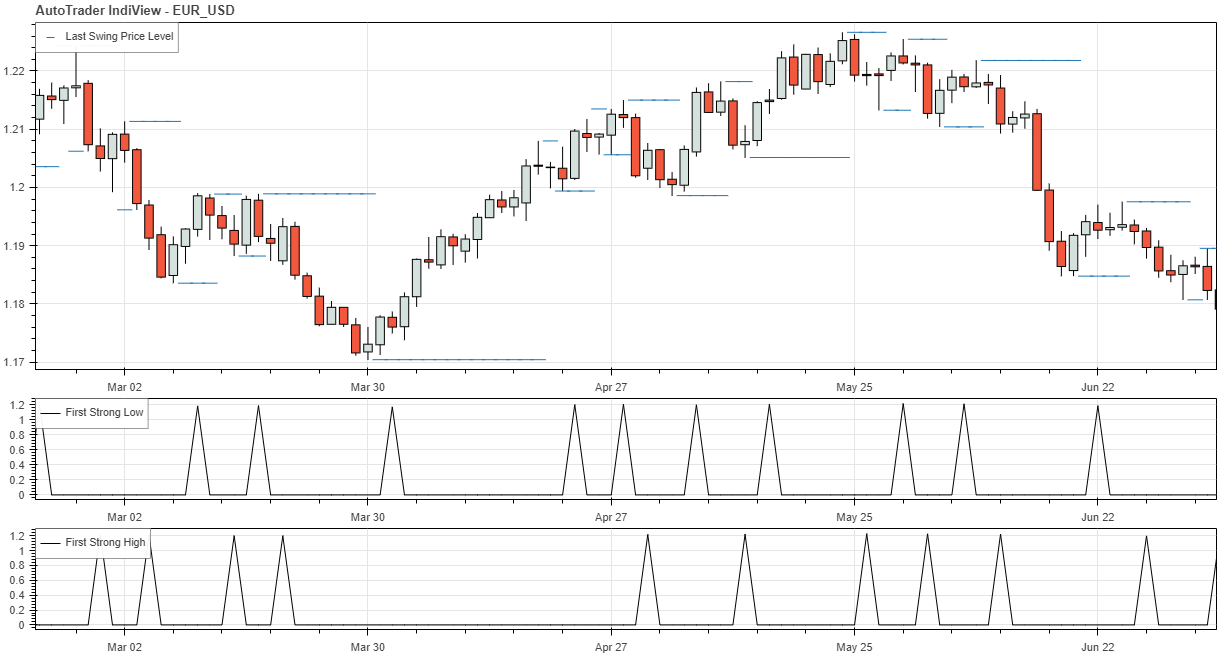
Since we want to detect divergence as quick as possible, we are most interested in the first occurence of a strong high or
strong low level being detected. For this purpose, I have used another custom indicator,
unroll_signal_list. This can be used to take our ‘Strong_lows’ and
‘Strong_highs’ and return a single value for each time a new stong low or high is detected. See the chart below for a visual
representation of this.
# Remove duplicates to preserve indexes of new levels
swing_df['FSL'] = unroll_signal_list(swing_df['Strong_lows']) # First of new strong lows
swing_df['FSH'] = unroll_signal_list(swing_df['Strong_highs']) # First of new strong highs
Finding Higher Highs and Lower Lows
Now that we can detect each time a new strong level is achieved, we can detect higher highs and lower lows. First, we can
calculate the change in successive lows and highs: low_change and high_change in the code snippet below.
# Now compare each non-zero value to the previous non-zero value.
low_change = np.sign(swing_df.FSL) * (swing_df.FSL - swing_df.Strong_lows.replace(to_replace=0, method='ffill').shift())
high_change = np.sign(swing_df.FSH) * (swing_df.FSH - swing_df.Strong_highs.replace(to_replace=0, method='ffill').shift())
Take a look at what these look like in the chart below. Plotted are the low_change values. Note that when a lower low appears,
the low_change is negative. On the other hand, when a higher low appears, the low_change is positive.
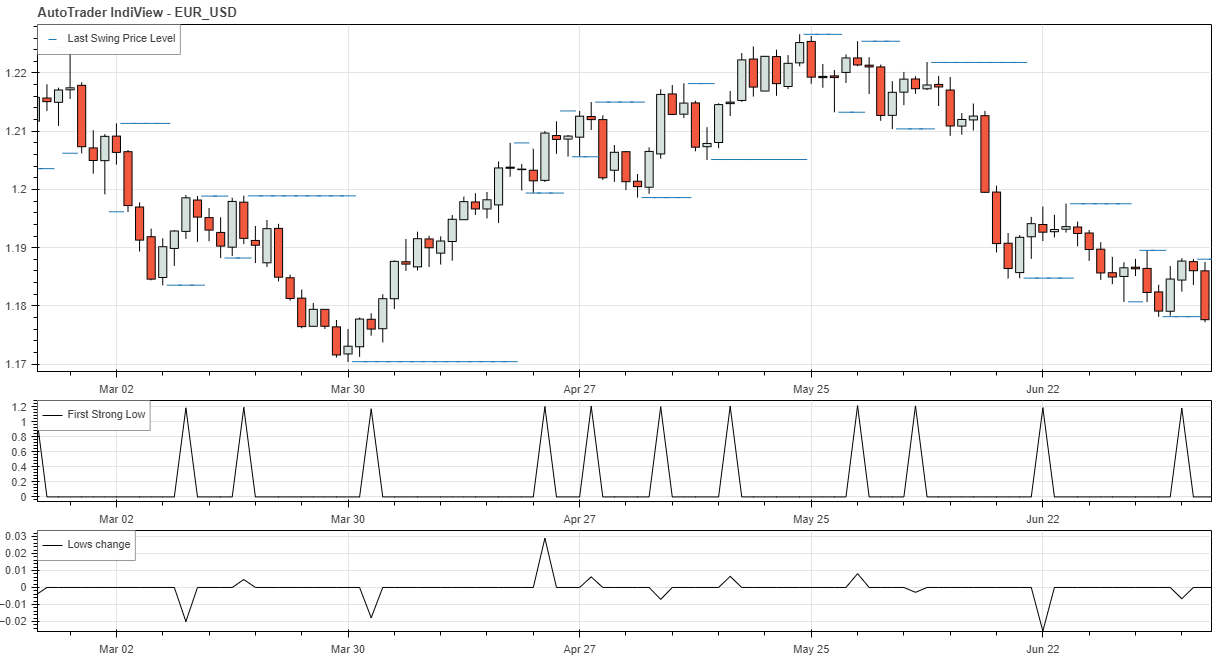
Using this information, we can calculate higher highs, lower lows, higher lows and lower highs. This is shown below.
swing_df['LL'] = np.where(low_change < 0, True, False)
swing_df['HL'] = np.where(low_change > 0, True, False)
swing_df['HH'] = np.where(high_change > 0, True, False)
swing_df['LH'] = np.where(high_change < 0, True, False)
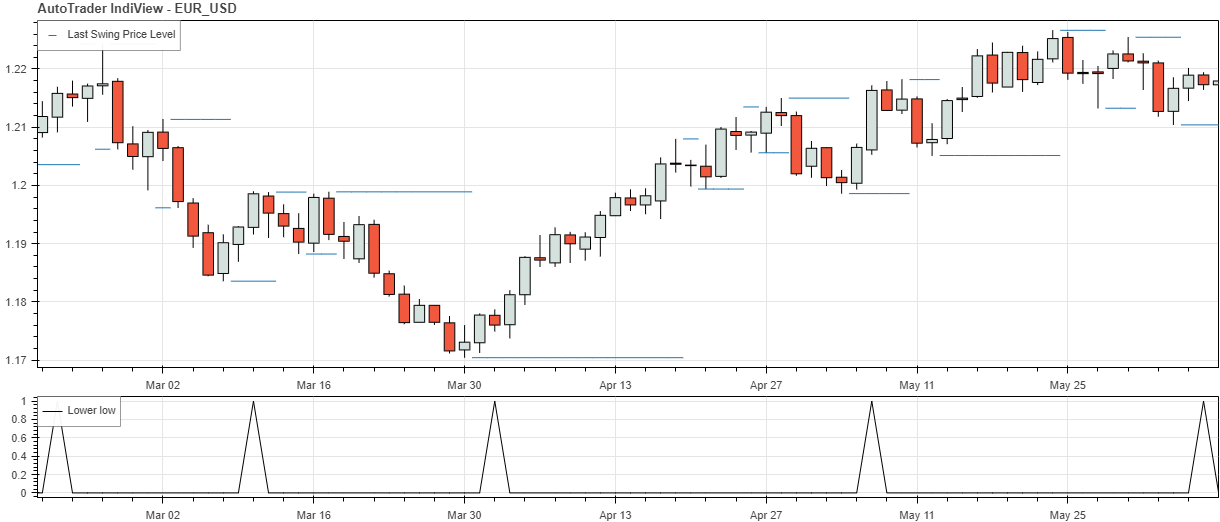
Now, let’s look what sort of signals this is giving us. Plotted below are the lower lows, from the column labelled LL.
Looks pretty good to me so far.
Testing on the RSI
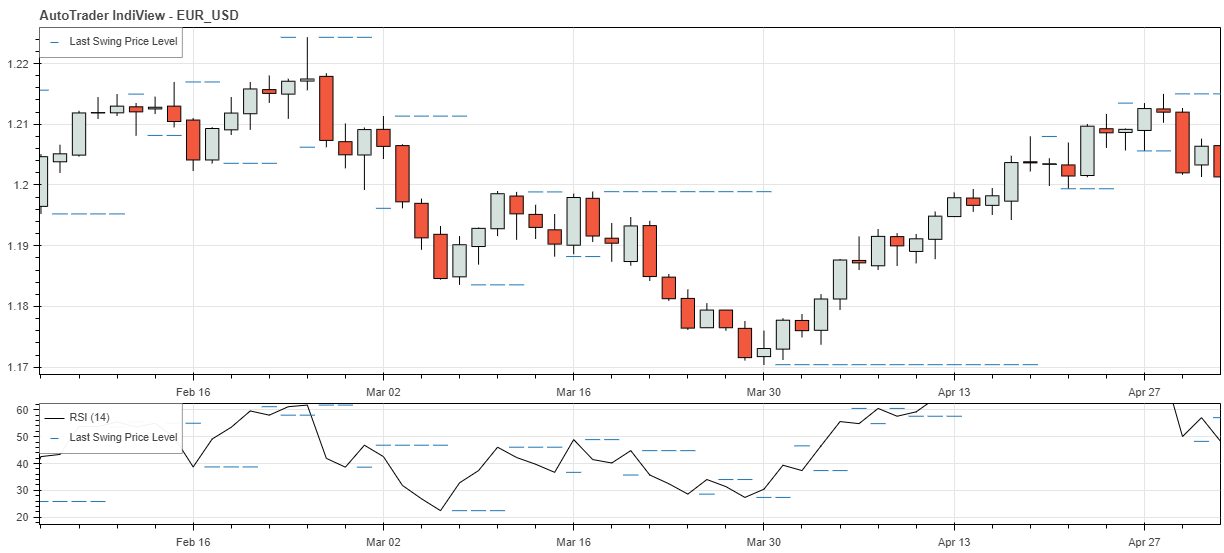
The code developed above used price data as an example to detect higher highs and lower lows, but the same code can be applied to any indicator of choice. For example, consider we replace the price data with the RSI with period of 14. As the chart below shows, we can apply the same process.
Detecting Divergence
The final step is to combine the tools and indicators developed above, and to apply them on price and an indicator of
choice to detect divergence. Following on with the examples above, consider the EUR/USD pair with RSI. First, we use
the find_swings indicator on both price and the RSI to detect data swings. Then, we can classify the swings as higher
highs or lower lows using the classify_swings indicator. Finally, we can compare the the results of the swings in price
to the swings in the indicator to detect regular and hidden divergences.
Take regular bullish divergence as an example. This occurs when price forms a lower low, but the indicator forms a higher
low. Just in case the lower low and higher high do not match up perfectly, I have defined a tolerance parameter tol, to
allow signals to occur within a certain number of candles of each other. The code below only shows detection of regular
bullish divergence, but the same logic can be applied to the other types of divergence as well.
regular_bullish = []
for i in range(len(classified_price_swings)):
    # Regular bullish - Lower low in price and higher low in indicator
    if sum(classified_price_swings['LL'][i-tol:i]) + sum(classified_indicator_swings['HL'][i-tol:i]) > 1:
        regular_bullish.append(True)
    else:
        regular_bullish.append(False)
    ...
The Results
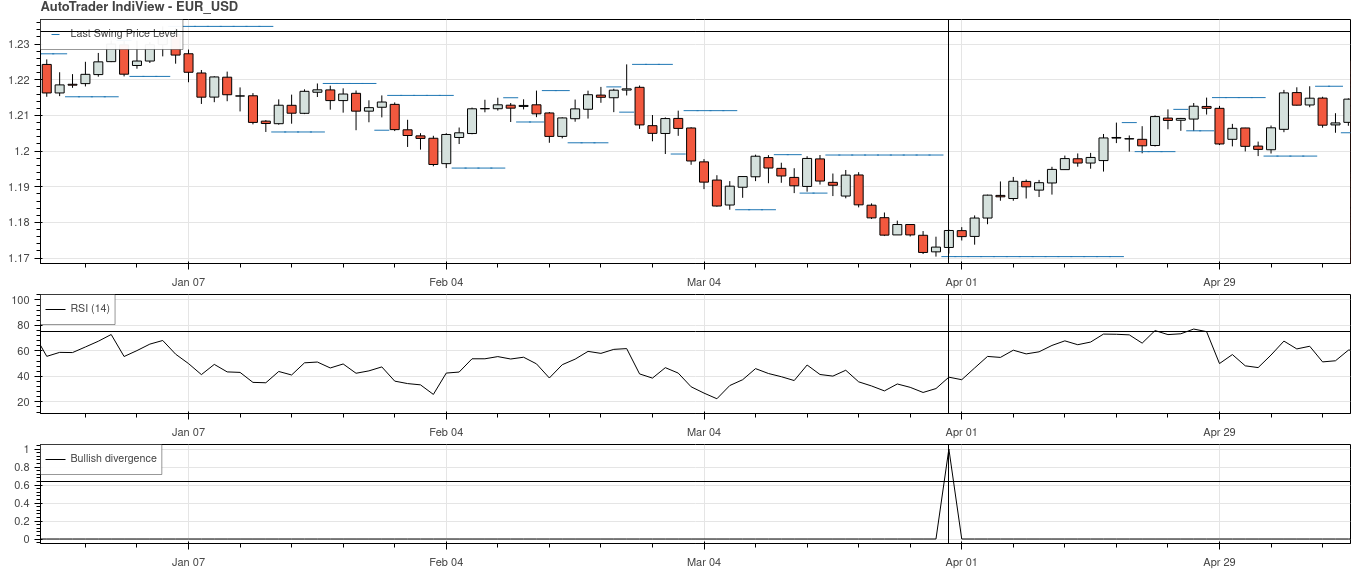
The image below is a cherry-picked example of the divergence detection indicator at work. Comparing this to TradingView’s divergence indicator shown at the start of the post, we can see that it picks up the same bullish divergence - one candle earlier! In the example below, this corresponds to a little over 60 pips!
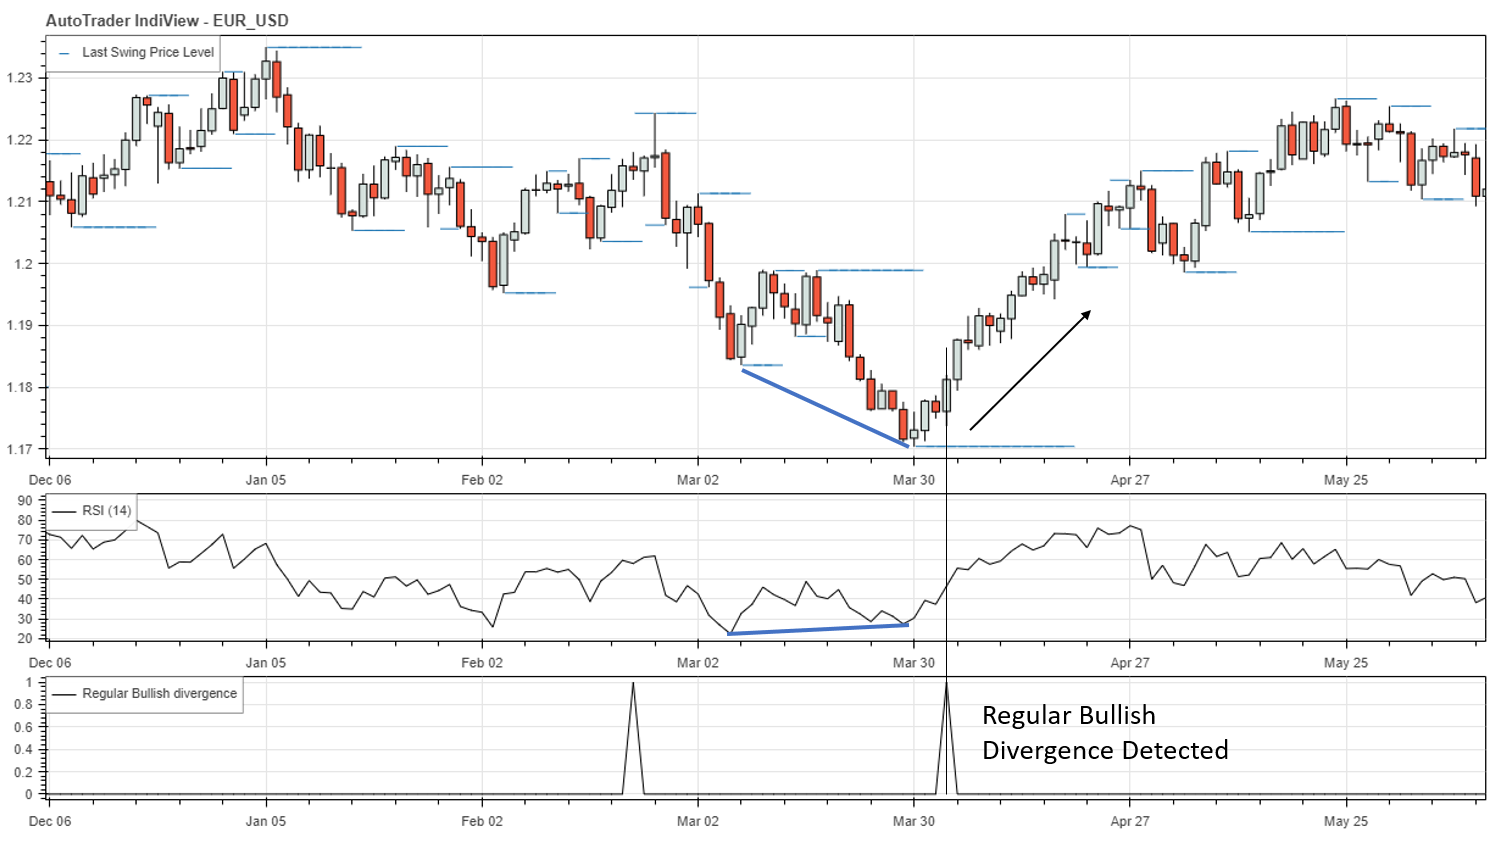
As mentioned above, this is a cherry picked example of the indicator working. In fact, you can see a false signal in the same image above. Examining what happened here, it is clear that the false signal is due to a false detection of a lower low. To avoid this, we would have to filter out smaller retracements - such as the ‘higher low’ in the lower-low pair.
Improvements
To reduce the number of false signals detected, I have added an alternative method of calculating divergence. To explain, consider the case of regular bullish divergence, which occurs when there is a lower low in price and a higher low in the indicator. In the method above, divergence was detected when the lower low in price and higher low in the indicator occured approximately simultaneously. The problem with this is when price forms a false swing level due to regular price fluctuations - as you can see in the chart above. To avoid this, the alternative method first focuses on the higher lows of the indicator, and then checks if price happens to be at a lower level compared to the previous indicator low (the lower low of the indicator). This sounds confusing, so take a look at the chart below for a visual explanation.
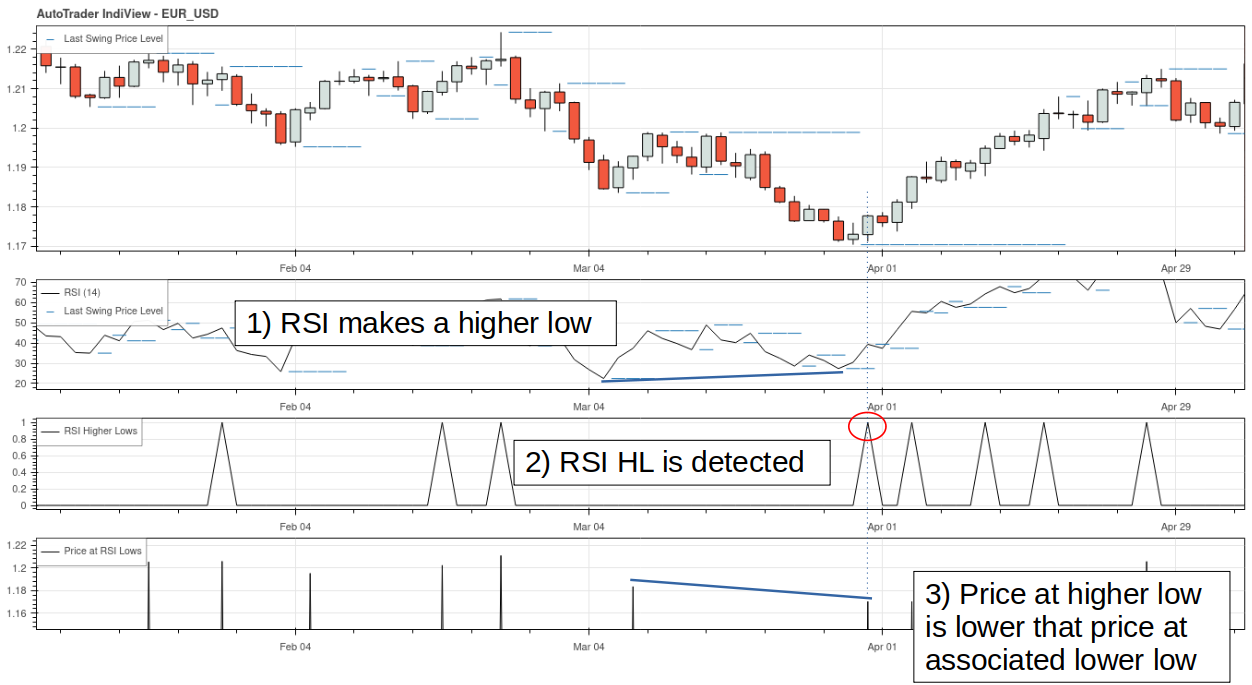
Now, whenever the price is lower when the indicator makes a higher low, we can detect bullish divergence. Following on with the same example above, this new method produces the following chart. Not only has the false signal been eliminated, but the divergence signal comes 2 candles earlier! This is equivalent to an extra 35 pips!
What Now?
The tools developed above have been packaged conveniently into indicators and added to the AutoTrader indicator library. You can find them under the following names:
If you do not care about the intermediate steps, you can use the
autodetect_divergence indicator, which is a wrapper for the indicators above.
This means that you can go straight from price data and indicator data to detecting divergence with a single line of code.
The next steps I plan to take with this indicator involve fine tuning the tolerance parameters and running some backtests.
If you have any questions, please feel free to send me an email.
References
[1] - Definition of divergence
[2] - Trading with divergence