This post will act as a tutorial of sorts, going through the process you may use to develop a market scanner using AutoTrader’s scan mode. By the end of this post, you will have a market scanner which will notify you of trending markets. This is perfect for traders who prefer to trade manually, but would like to automate some aspect of their trading, such as filtering instruments to trade for the day.
The example in this post is intended for forex markets, but could be extended to any other market by modifying the strategy/scan watchlist. The GBP/NZD forex pair will be used throughout to develop the code, but the scanner will eventaully be run on all major forex pairs. The technical analysis will be performed on daily candlestick data. The Yahoo Finance API will be used so that you can run this code straight out of the box, but if you plan to use this scanner for trading with one of AutoTrader’s supported brokers, you can easily (and should) switch the data feed.
As with many of the code presented on this website, the code can be found in the demo repository.
Getting Started
First, we need to build a custom indicator that acts as a flag for our scan.
Since we want to be notified of trending markets, this indicator will return a value
of 1 when the market begins an uptrend, and -1 when it begins a downtrend.
The Underlying Strategy
To build our trend notification indicator, we will rely on the supertrend indicator and a 200 period exponential moving average for confluence. A uptrend will be signalled as beginning when the supertrend indicator changes from a downtrend to an uptrend, while price is above the 200 EMA. The opposite is true for a downtrend signal. Enough words! Let’s use IndiView to visualise this strategy (check out a previous blog post to learn more about IndiView here).
IndiView script
from autotrader.autoplot import AutoPlot
from autotrader.lib.autodata import GetData
from autotrader.lib.indicators import supertrend
from finta import TA

get_data = GetData()

instrument = 'GBPNZD=X'
data = get_data.yahoo(instrument, '1d',
                      start_time='2020-01-01',
                      end_time='2020-02-01')

ema200 = TA.EMA(data, 200)
st_df  = supertrend(data, ATR_multiplier=2)

indicator_dict = {'Supertrend': {'type': 'Supertrend',
                                  'data': st_df},
                  'EMA (200)': {'type': 'MA',
                          'data': ema200}
                  }

ap = AutoPlot(data)
ap.plot(indicators=indicator_dict, instrument=instrument)
Uptrend Set-Up
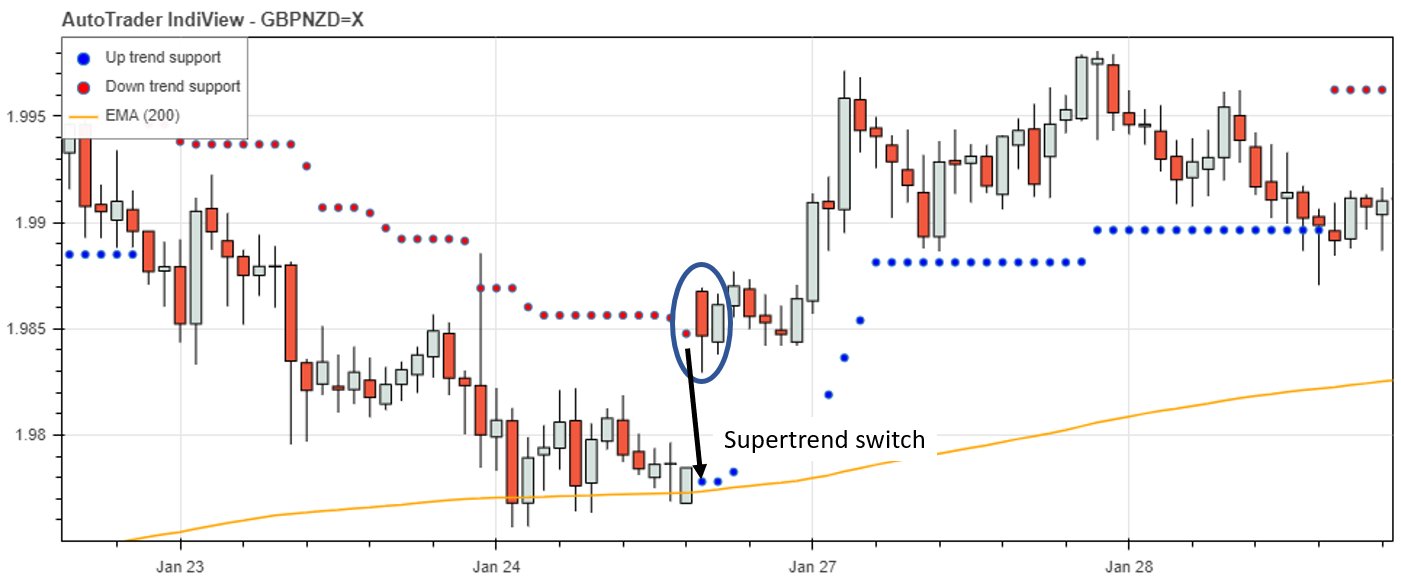
The image below shows an up-trend set-up. Note that the supertrend indicator switches from a downtrend to an uptrend (where the red resistance dot becomes a blue support dot) and price is above the 200 EMA. It is on this candle that we would want to recieve an email about the up-trend. We will sort this out in the next section using a custom indicator.

Signal Indicator
Now that we know what we are looking for, we just need to create some simple logic to return 1 when an uptrend is detected,
and -1 when a downtrend is detected. This logic is shown in the code snippet below.
Signal Logic
signals = np.zeros(len(data))
for i in range(len(signals)):
    if data.Close[i] > ema200[i] and \
    st_df.trend[i] == 1 and \
    st_df.trend[i-1] == -1:
        # Start of uptrend
        signals[i] = 1

    elif data.Close[i] < ema200[i] and \
    st_df.trend[i] == -1 and \
    st_df.trend[i-1] == 1:
        # Start of downtrend
        signals[i] = -1
Visualising the Indicator
This indicator can be added to the previous plot by including it in the indicator_dict dictionary, as shown below.
indicator_dict = {'Supertrend': {'type': 'Supertrend',
                                  'data': st_df},
                  'EMA (200)': {'type': 'MA',
                          'data': ema200},
                  'Signal': {'type': 'below',
                             'data': signals}
                  }
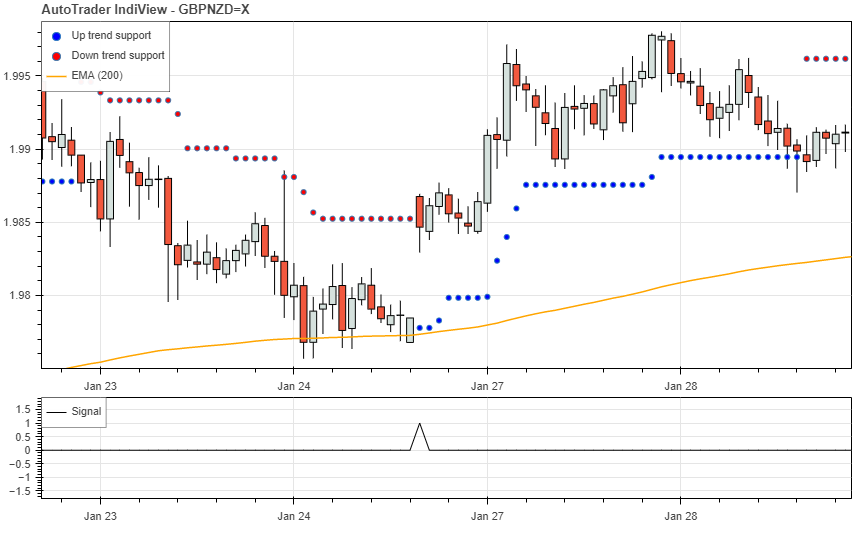
Finally, we can visualise our indicator, and the signals it returns. From the image below, it is working as expected; we get a long signal when all conditions are met. We can also use the visualisation tool to verify that our short signals are also being detected correctly.

Building the Scanner
To use this indicator to recieve scan notifications, we need to build it into an AutoTrader strategy. Since we have already built the indicator, building the strategy will be easy - it is the exact same logic. This is provided in the code below. Head over to the tutorials or strategy documentation if you need a little more explanation.
# Package import
from autotrader.lib.indicators import supertrend
from finta import TA

class SuperTrendScan:
    """
    Supertrend Signal Generator
    -----------------------------
    The code below was developed for detecting trends using the SuperTrend
    indicator. You can read more about it at:
        https://kieran-mackle.github.io/AutoTrader/blog

    """

    def __init__(self, params, data, instrument):
        ''' Initialise strategy indicators '''
        self.name   = "SuperTrend"
        self.data   = data
        self.params = params

        self.ema200 = TA.EMA(data, 200)
        self.st_df  = supertrend(data, period = 12, ATR_multiplier = 2)


    def generate_signal(self, i, current_position):
        ''' Generate long and short signals based on SuperTrend Indicator '''

        order_type  = 'market'
        signal_dict = {}

        if self.data.Close[i] > self.ema200[i] and \
           self.st_df.trend[i] == 1 and \
           self.st_df.trend[i-1] == -1:
            # Start of uptrend
            signal = 1

        elif self.data.Close[i] < self.ema200[i] and \
           self.st_df.trend[i] == -1 and \
           self.st_df.trend[i-1] == 1:
            # Start of downtrend
            signal = -1

        else:
            signal = 0

        # Construct signal dictionary
        signal_dict["order_type"]   = order_type
        signal_dict["direction"]    = signal

        return signal_dict
Configuration
Strategy configuration
We also need to write a strategy configuration file. This will tell AutoTrader which instruments to apply the strategy to.
NAME: 'SuperTrend Scanner'
MODULE: 'alt_supertrend'
CLASS: 'SuperTrendScan'
INTERVAL: '1d'
PERIOD: 300
RISK_PC: 1.5
SIZING: 'risk'
PARAMETERS:
  ema_period: 200

WATCHLIST: ['EURUSD=X',
            'AUDCAD=X',
            'EURJPY=X',
            'EURAUD=X',
            'AUDJPY=X']
Global configuration
To recieve emails each time the scan gets a hit, we also need to provide an email address (you will also need to set up a host email account). The most convenient way to do this is by creating a global configuration file. That way, you can use the same email address for future strategies. The global configuration file will look something like this:
EMAILING:
  HOST_ACCOUNT:
    email: "host_email@gmail.com"
    password: "password123"
  MAILING_LIST:
    FirstName_LastName:
      title: "Mr"
      email: "your_personal_email@gmail.com"
Run File
Finally, we can construct a run file, to pass our strategy to AutoTrader and run the scan.
Note that to activate email notifications, you will also have to use the configure method
of AutoTrader to specify the notify verbosity. You can do this by adding at.configure(notify=1)
after creating the AutoTrader instance.
'''
AutoScan Demonstration
----------------------
'''

# Import AutoTrader
from autotrader.autotrader import AutoTrader

# Create AutoTrader instance
at = AutoTrader()
at.scan('supertrend')
at.run()
Automated Running
Unless you are happy to run the scan script manually for as long as you use the scan, you need to automate it. After all, that is part of of what makes algo-trading so appealing! Although there are a number of ways to do this, a relatively simple and effective way is to use a cron job. The cron snippet below will run the scanner run file at 7 AM on every day from Monday through to Friday.
0 7 * * 1-5 ~/home_dir/run_scan.py
Sample Scan Hit
When the scan detects a hit, a message containing the details of the hit will
be printed to the command window. If you have set notify to above 0, you
will also be sent an email.
Command window message
Running the scanner on the forex major pairs, the following output was produced. As you can see, short signals were detected for EUR/USD, GBP/USD, AUD/USD and NZD/USD. A long signal was also detected for USD/CAD. Clearly there is some strong movement in the US dollar!
EURUSD=X: Short signal detected.
USDJPY=X: No signal detected.
GBPUSD=X: Short signal detected.
AUDUSD=X: Short signal detected.
USDCAD=X: Long signal detected.
USDCHF=X: No signal detected.
NZDUSD=X: Short signal detected.
Email message
With a value of notify set to 1 or greater, emails will be sent for each of
the signals detected above. For example, the following email was sent for EUR/USD.
Dear Mr Mackle,
This is an automated message to notify you of a recent match in a market scan you are running. The details of the scan are as follows.
Time of scan: 12:32:23.
Scan strategy: SuperTrend.
Scan index: major.
The results from the scan are shown in the table below.
Pair Signal Price Size Stop Loss Take Profit EURUSD=X 1.17426 Short None None All the best in your trading endeavours,
AutoTrader
A Useful Modification
The modified strategy is named ‘alt_supertrend.py’ in the demo repository
Perhaps you slept in a little bit late one day and missed a signal from the scanner. When the scanner runs the next day, you will not be notified of that trend, since the indicator developed above only pings on the first candle of a new trend being detected. But what if we are happy to get into the trend a little bit late?
To make it such that we receive a signal even a few candles late, lets add a candle tolerance parameter to our strategy. Our strategy configuration file will then look something like this:
NAME: 'SuperTrend Scanner'
MODULE: 'alt_supertrend'
CLASS: 'SuperTrendScan'
INTERVAL: '1d'
PERIOD: 300
RISK_PC: 1.5
SIZING: 'risk'
PARAMETERS:
  ema_period: 200
  candle_tol: 3
In the code above, our tolerance is set to 3, meaning that we will get the signal up to 3 candles after it first occurs. Now let’s add the logic to the strategy module. We will use two custom indicators from the AutoTrader library: candles_since_signal and rolling_signal. The first of these will count how many candles have passed since the last signal, and the second returns a list which maintains the previous signal received.
# Candles since last signal
self.candles_since_signal = candles_between_crosses(self.signals)

# Rolling signal list
self.rolling_signal = rolling_signal_list(self.signals)
Now, we can use these indicators in our signal generation function:
if self.rolling_signal[i] == 1 and \
   self.candles_since_signal[i] < self.params['candle_tol']:
    # Start of uptrend
    signal = 1

elif self.rolling_signal[i] == -1 and \
    self.candles_since_signal[i] < self.params['candle_tol']:
    # Start of downtrend
    signal = -1

else:
    signal = 0
Now we can run the scanner again, and capture any signals that have occured within our candle count tolerance!